4 Key Sales Enablement Metrics That Matter
As we all know, Sales enablement consists of various strategies and processes that boost the sales process and aid the sales ecosystem of your company. It can easily be described as steps that help your company sell (more) effectively. But Sales enablement is more like a Tamagotchi, It requires constant checks up to make sure that you are on-track to reach the goals you set out for, and you are to closely monitor the progress of your sales enablement strategy through sales enablement metrics.
"If you can measure it, you can improve it."
What Are Sales Enablement Metrics?
Sales enablement metrics, by extension, are measurements used to evaluate how effectively your sales enablement strategies are supporting your sales team. These metrics can include anything from the rate at which your sales team adopts the resources you provide them, to the quality and usage of your sales and marketing collateral.
As you would agree, closing a sale is a complex undertaking that has numerous avenues for underperformance or worse, failure. Tracking sales enablement lets you dive deep into the sales process and smoothen out the rough edges, hence boosting efficiency and increasing revenue.
Get Actionable Insights That Moves Sales Forward
Why Do You Need Sales Enablement Metrics?
When you decide to start tracking sales enablement, it is quite possible that you might get lost in a sea of metrics. It is important for us to understand that the intention is not to create more work but to make rational business decisions.
Measuring the success of your sales enablement strategies or processes is crucial for the following reasons:
- It ensures that all the strategies align with your overall business goals.
- It identifies what’s working and what’s not.
- It highlights where there is room for improvement and areas needing adjustment.
- It prevents waste of time, money, and resources.
By carefully tracking these metrics, you ensure that your sales enablement efforts are both effective and contributing positively to your bottom line. Most importantly, you prevent your business from losing money and other valuable resources to ineffective sales enablement.
How to Identify the right metrics to track?
When you decide to start tracking sales enablement, it is quite possible that you might get lost in a sea of metrics. It is important for us to understand that the intention is not to create more work but to make rational business decisions.
The first step to identify the right metrics is to understand that, Key sales metrics must align with your core business objectives, focusing on driving revenue growth, shortening sales cycles, and boosting sales rep efficiency.
Select metrics that directly reflect progress towards these strategic goals, ensuring your tracking efforts yield actionable insights and clear direction for your sales enablement strategy.
For example:
If you are looking to measure the revenue growth, you should consider the metrics like - Total revenue generated in a specific period of time, track the percentage increase in sales revenue, revenue generated per sale
There are two (2) types of metrics to consider when measuring sales enablement: quantitative metrics and qualitative metrics. These different metric types offer insights into your sales performance from different perspectives.
Now here’s how to track your sales enablement metrics:
1. Identifying the Sales Enablement Goals.
Before diving into metrics, you must clearly define your sales enablement goals. This step involves understanding what success looks like for your sales team and organisation. Whether it’s increasing your closing rate, shortening your sales cycle, or boosting sales rep productivity, your goals will guide which aspects of sales performance analytics need close monitoring.
2. Finding the Relevant Metrics.
There are specific metrics that align with your goals. For your business, these sales enablement KPIs could be lead conversion rates, average deal size, or sales cycle length. Finding the metrics that are most relevant to your business is crucial as these are what accurately reflect the impact of your sales enablement efforts on overall sales performance.
3. Establishing a Baseline.
To measure the impact of sales enablement, establish a baseline of performance before you implement. This involves collecting data on what your ideal results and metrics should look like prior to introducing new sales enablement tools or strategies. By measuring sales performance against this baseline both before and after implementation, you can see the difference your sales enablement efforts make.
4. Gathering the Data.
With your goals and relevant metrics defined, and your baseline established, the next step is to gather data. This involves tracking the chosen metrics over time, using sales enablement analytics tools. Accurate and consistent data collection is key to measuring the effectiveness of your sales enablement strategies and making informed decisions for future improvements.
Sales Enablement Metrics and KPIs the Same?
Sales enablement metrics are broad measurements that track the performance of sales enablement strategies. An example is sales and marketing collateral usage rates, which show how often sales materials are utilized by your sales.
Sales enablement KPIs (Key Performance Indicators), on the other hand, are specific, targeted indicators that measure the success of sales enablement efforts against predefined goals. An example is quota attainment, which measures the percentage of sales reps meeting or exceeding their sales targets.
They are largely similar concepts and are often used interchangeably. But metrics provide a wide view, while KPIs focus on key outcomes.
"Unless you don't know where the injury is, you cannot put a band-aid on it."
17 Most Important Sales Enablement Metrics:
Sales enablement metrics combine both marketing content performance metrics and sales performance metrics. These include sales metrics such as sales cycle length, deals won, and revenue per deal, alongside marketing content metrics like content effectiveness, deals closed influenced by content, and content usage.
Listed here are are the 17 Metrics that are of utmost importance:
1. Sales Cycle Length: This measures the average time taken from initial lead generation to final deal closure. Shorter cycles indicate that your sales processes are efficient and effective. A well-managed sales cycle not only boosts revenue but also enhances customer satisfaction by delivering timely solutions.
The formula = Total days taken to close deals/Number of closed deals
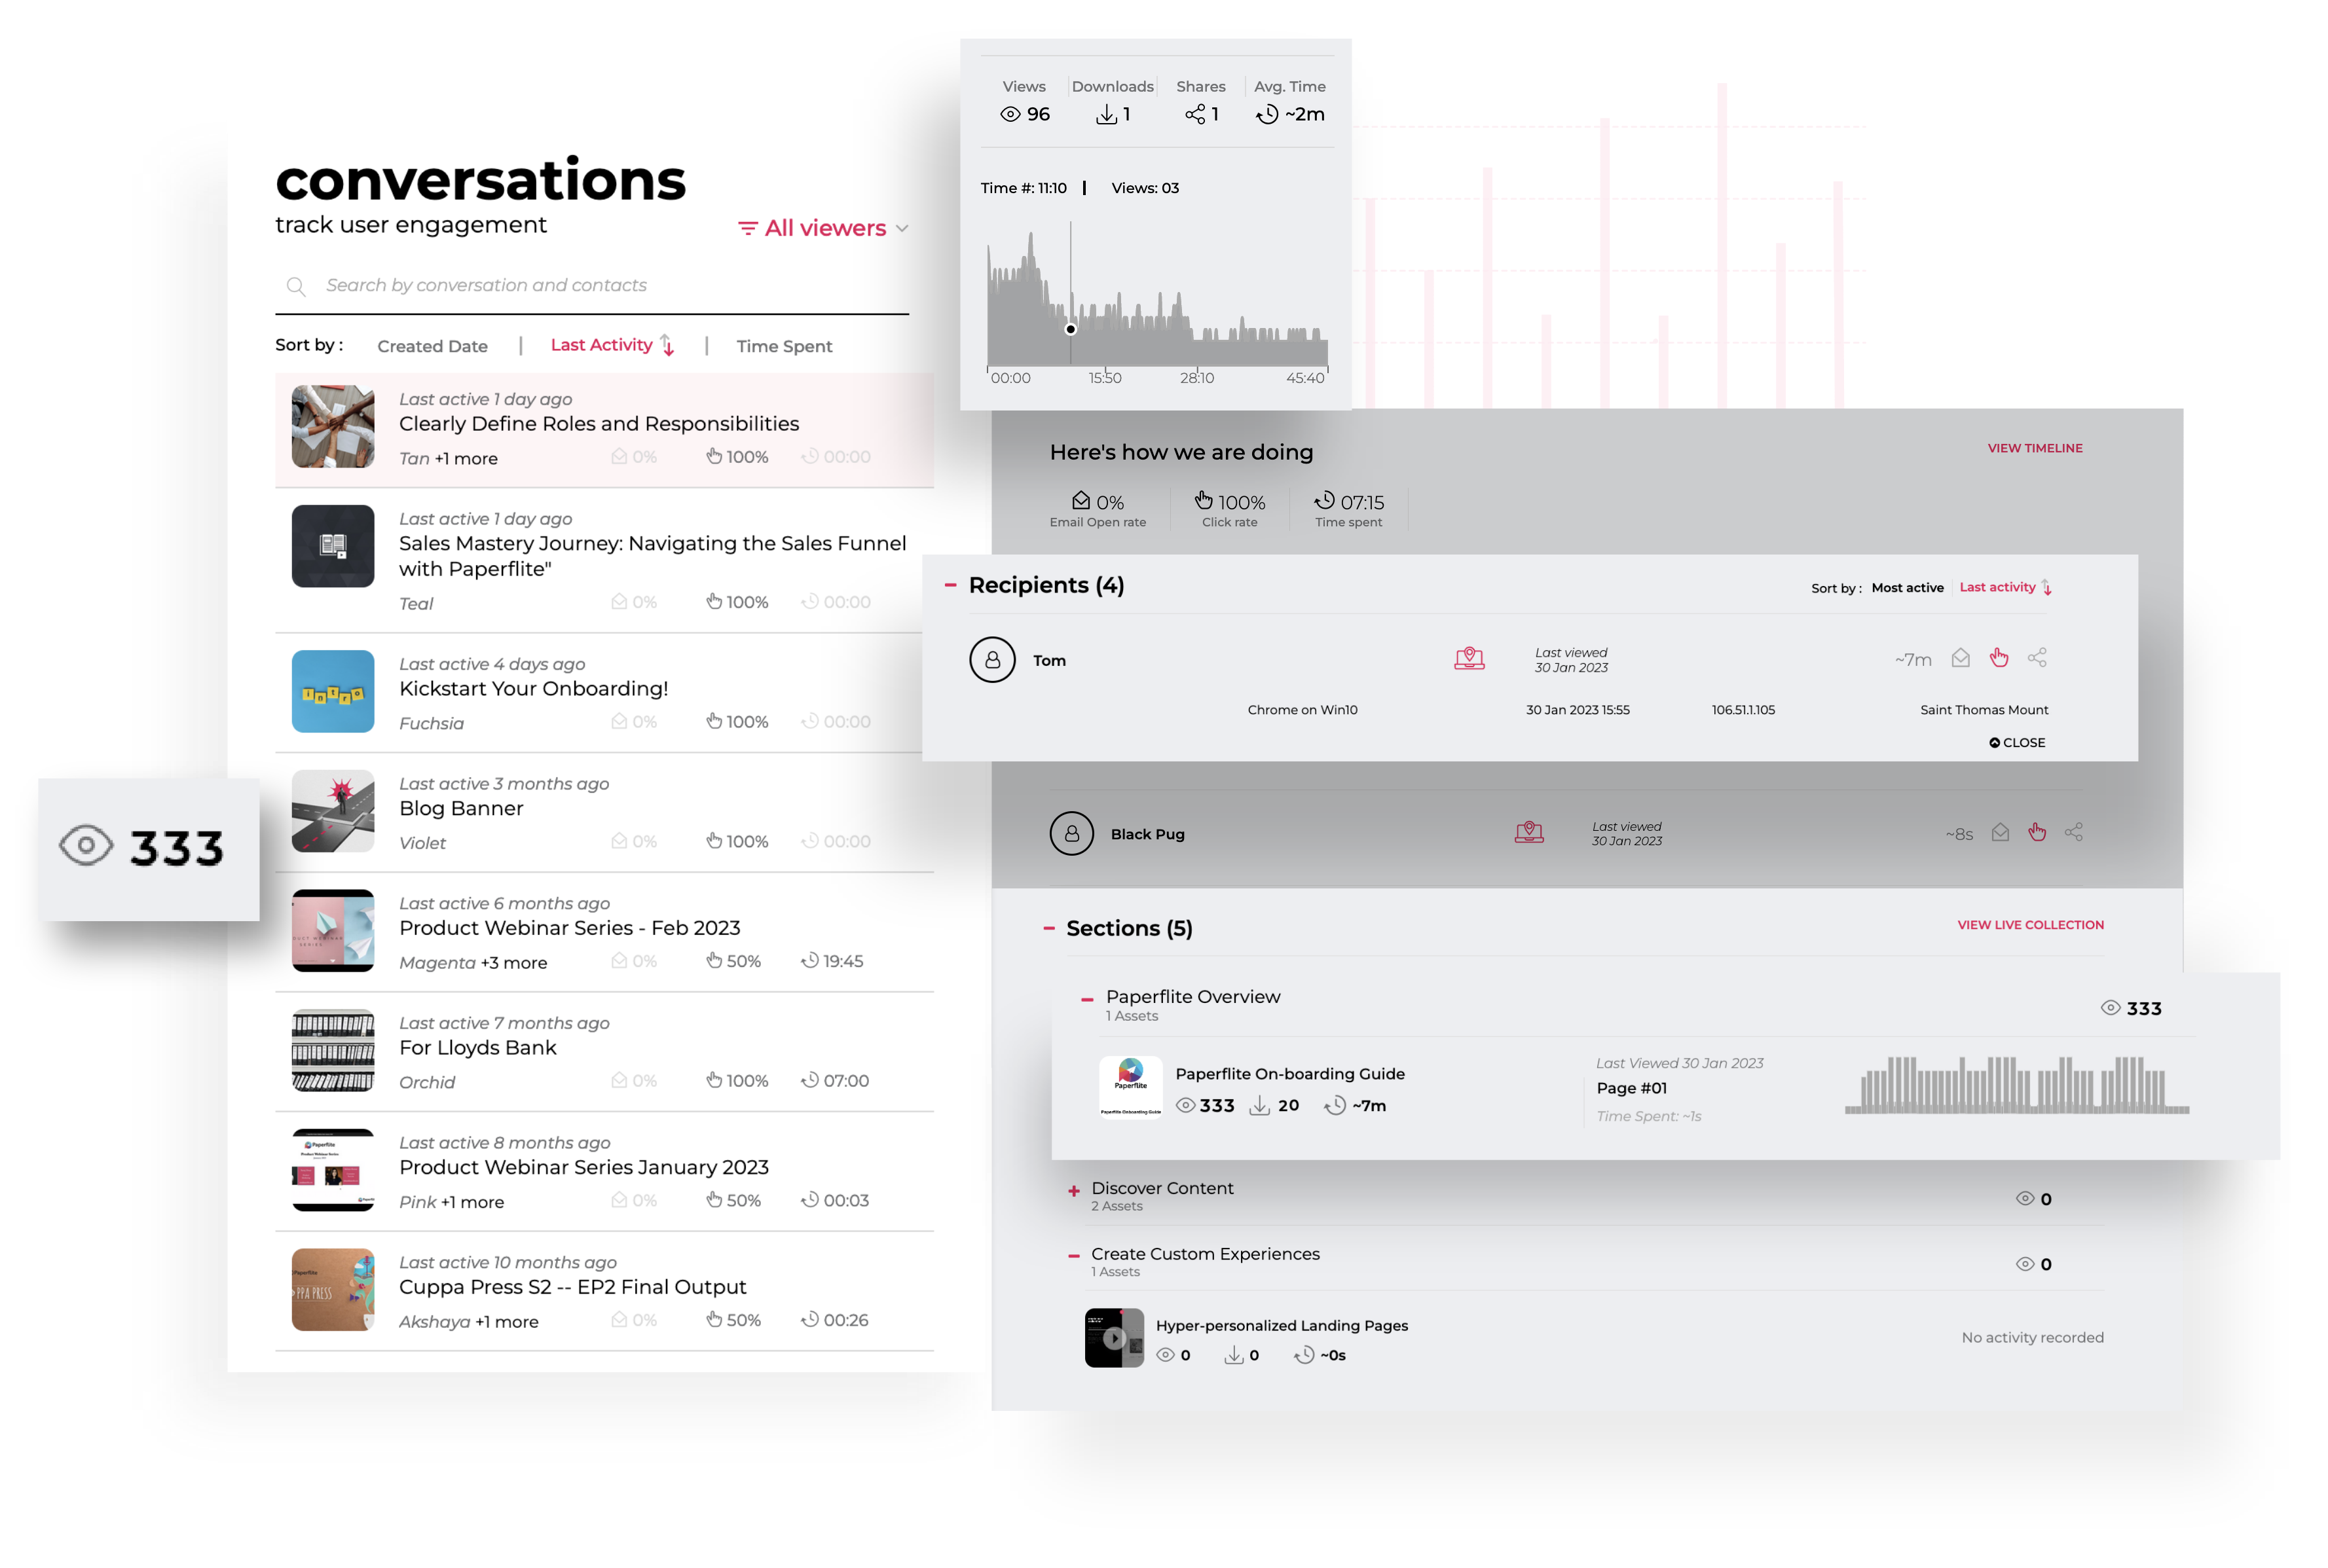
2. Rep Engagement with Content: This assesses how actively your sales reps use and interact with sales materials. High engagement suggests that content is relevant and useful in your sales process. This engagement directly influences sales effectiveness and deal conversion rates.
3. Time Spent Searching for the Right Content by Reps: This metric gauges the duration sales reps spend finding relevant sales materials. Streamlining this search process not only enhances reps' efficiency but also contributes to revenue growth by enabling more customer interactions.
In practice, a notable example includes Aspire, which achieved considerable cost savings by optimizing their content discovery process.
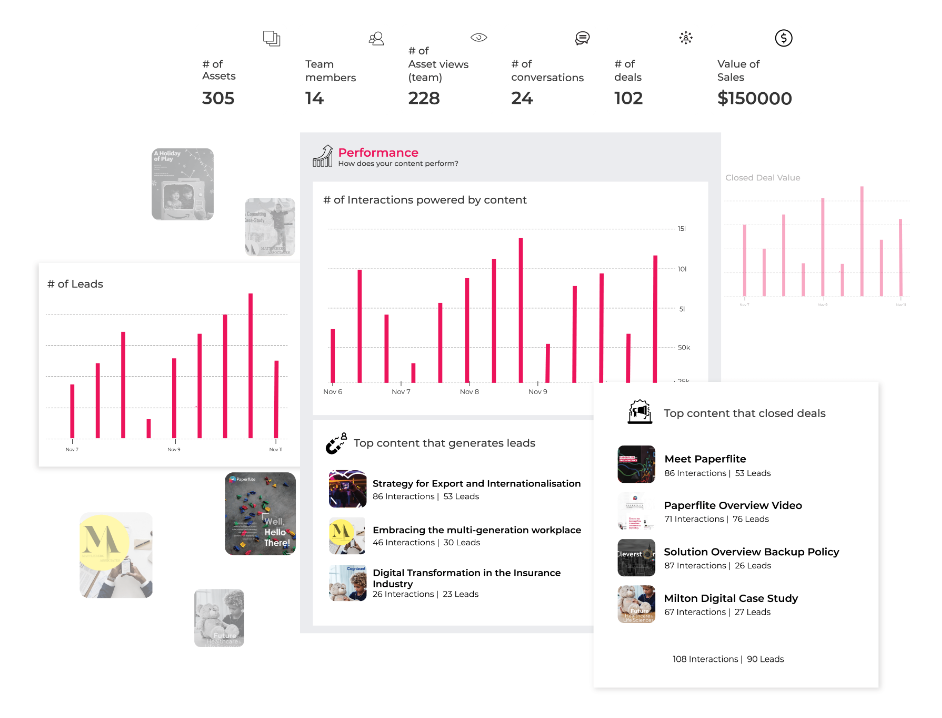
4. Lead-Generating Content: This identifies specific content that directly contributes to lead generation and highlights what exactly resonates with your target market. Understanding this helps tailor future content strategies to audience preferences, enhancing lead quality.
5. Revenue Generated by Content: This calculates the total revenue generated from the use of specific content, specifically your top content that closes deals.
The formula = Total revenue from content - Cost of content creation
6. Campaign Performance: This evaluates the success of your marketing campaigns in meeting sales and marketing objectives. Metrics include engagement, time spent on and views of each campaign, etc.
7. Revenue Generated per Rep: This measures individual productivity and effectiveness within your sales team.
The formula = Total revenue generated/Number of sales representatives
8. Time Spent on Content Creation: This quantifies the total time invested in producing marketing or sales materials. Here, a tool like Cleverstory will help you to both reduce this time through an easy content creation and management process, as well as track the time you spend on content creation as a metric.
9. Lead Conversion Rate: The percentage of your leads that successfully convert into customers.
The formula = Number of conversions/Number of leads *100
10. Email Open and Response Rate: This measures engagement with your email campaigns via the percentage of opened emails and their subsequent response rate. This can be tracked using conversion metrics.
11. Cost per Lead: The average cost incurred to generate a new lead. It also bears on the efficiency of your lead generation strategies.
The formula = Total cost of lead generation/Number of leads generated
12. Deal Velocity: This measures the speed at which deals move through your sales funnel. Faster velocities indicate a streamlined, efficient sales process.
The formula = Total revenue/Total days in the sales cycle
13. Customer Lifetime Value (CLV): This predicts the total revenue your business can expect from a single customer account over their entire relationship with your company.
14. Deals Lost to Competition: This identifies deals that were won by competing companies, giving you insights into your competitive disadvantages and areas that need strategic adjustment.
15. Content Usage: This tracks how and how often your sales reps utilize available sales and marketing content. This can be tracked using a content discovery matrix.
16. Time Taken to Productivity: This measures the duration it takes for a new sales rep to become fully productive, starting from their training period to the point where they begin to effectively contribute to the sales process. This metric also reflects the effectiveness of your training program
17. Upselling and Cross-selling Rates: This is the percentage of your customers who also purchase additional products (upselling) or related products (cross-selling).
FAQs.
What is the sales enablement benchmark?
The sales enablement benchmark is a standard or reference point for measuring the effectiveness of a sales enablement strategy. You can set your company’s benchmark against industry averages or your past performance.
What are the three pillars of sales enablement?
The three pillars of sales enablement are training and development, sales content management, and sales and marketing alignment.
What is the impact of sales enablement?
The impact of sales enablement includes improved productivity of your sales team, shorter sales cycles, higher closure rates, and increased revenue growth.
What are the leading and lagging metrics of sales enablement?
Leading metrics predict future performance; an example is content engagement. Lagging metrics reflect past results, such as closure rates and revenue per rep.